ಮೂಲ ಕಡತ(SVG ಫೈಲು, ಸುಮಾರಾಗಿ ೯೬೦ × ೯೬೦ ಚಿತ್ರಬಿಂದುಗಳು, ಫೈಲಿನ ಗಾತ್ರ: ೧.೦೭ MB)

ಸಾರಾಂಶ

ವಿವರ
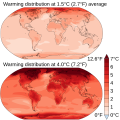
English: Coupled Model Intercomparison Project Phase 6 (CMIP6) multi-model mean projections (i.e., the average of the model projections available). Changes are shown relative to the 1850-1900. Data from the IPCC Sixth Assessment Report SPM.5. Note that maps were only produced for temperatures at 1C, 1.5C, 2C, and 4C. This graphic uses 1.5C and 4C as they average to the 2.7C that is the most likely outcome.
Français : Projections moyennes multimodèles de la phase 6 du projet d'intercomparaison de modèles couplés (CMIP6) (= moyenne des projections de modèles disponibles). Les changements sont indiqués par rapport à l'ère préindustrielle (1850-1900). Données du sixième rapport d'évaluation du GIEC SPM.5
ದಿನಾಂಕ
ಆಕರ ಸ್ವಂತ ಕೆಲಸ
ಕರ್ತೃ Efbrazil
ಇತರೆ ಆವೃತ್ತಿಗಳು French version

ಪರವಾನಗಿ

I, the copyright holder of this work, hereby publish it under the following license:
w:en:Creative Commons
ವೈಶಿಷ್ಟ್ಯ ಇರುವುದರಂತೆಯೇ ಹಂಚು
This file is licensed under the Creative Commons Attribution-Share Alike 4.0 International license.
ನೀವು ಮುಕ್ತ:
  • ಹಂಚಿಕೆಗೆ – ಕೆಲಸವನ್ನು ನಕಲು ಮಾಡಲು, ವಿತರಣೆ ಮತ್ತು ಸಾಗಿಸಲು
  • ರೀಮಿಕ್ಸ್ ಮಾಡಲು – ಕೆಲಸವನ್ನು ಬಳಸಿಕೊಳ್ಳಲು
ಈ ಕೆಳಗಿನ ಷರತ್ತುಗಳಲ್ಲಿ:
  • ವೈಶಿಷ್ಟ್ಯ – ನೀವು ಸೂಕ್ತವಾದ ಕ್ರೆಡಿಟ್ ನೀಡಬೇಕು, ಪರವಾನಗಿಗೆ ಲಿಂಕ್ ಅನ್ನು ಒದಗಿಸಬೇಕು ಮತ್ತು ಯಾವುದೇ ಬದಲಾವಣೆಗಳನ್ನು ಮಾಡಿದ್ದರೆ ಸೂಚಿಸಬೇಕು. ನೀವು ಯಾವುದೇ ಸಮಂಜಸವಾದ ರೀತಿಯಲ್ಲಿ ಮಾಡಬಹುದು, ಆದರೆ ಪರವಾನಗಿದಾರರು ನಿಮ್ಮನ್ನು ಅಥವಾ ನಿಮ್ಮ ಯಾವುದೇ ಬಳಕೆಯನ್ನು ಅನುಮೋದಿಸಿದಂತೆ ರೀತಿಯಲ್ಲಿ ಉಪಯೋಗಿಸಬಾರದು.
  • ಇರುವುದರಂತೆಯೇ ಹಂಚು – ನೀವು ರೀಮಿಕ್ಸ್ ಮಾಡಿದರೆ, ರೂಪಾಂತರಗೊಳಿಸಿದರೆ ಅಥವಾ ವಸ್ತುವಿನ ಮೇಲೆ ನಿರ್ಮಿಸಿದರೆ, ನಿಮ್ಮ ಕೊಡುಗೆಗಳನ್ನು ನೀವು ಮೂಲದಂತೆ ಅದೇ ಅಥವಾ ಹೊಂದಾಣಿಕೆಯ ಪರವಾನಗಿ ಅಡಿಯಲ್ಲಿ ವಿತರಿಸಬೇಕು.

These maps contain data from the IPCC that is not believed to be subject to their copyright. According to the wikimedia article discussing derivative works using maps none of the following are subject to copyright: data, colors, systems, and geographical boundaries. That covers all that these maps display- they are standard world maps colored to show expected temperature changes according to climate change models.

Captions

Add a one-line explanation of what this file represents
Distribution of temperature changes as predicted by the IPCC in AR6 relative to 1850-1900 baseline

Items portrayed in this file

depicts ಇಂಗ್ಲಿಷ್

some value

author name string ಇಂಗ್ಲಿಷ್: Efbrazil
Wikimedia username ಇಂಗ್ಲಿಷ್: Efbrazil

copyright status ಇಂಗ್ಲಿಷ್

copyrighted ಇಂಗ್ಲಿಷ್

source of file ಇಂಗ್ಲಿಷ್

original creation by uploader ಇಂಗ್ಲಿಷ್

೯ ಮಾರ್ಚ್ 2020

ಕಡತದ ಇತಿಹಾಸ

ದಿನ/ಕಾಲ ಒತ್ತಿದರೆ ಆ ಸಮಯದಲ್ಲಿ ಈ ಕಡತದ ವಸ್ತುಸ್ಥಿತಿ ತೋರುತ್ತದೆ.

ದಿನ/ಕಾಲಕಿರುನೋಟಆಯಾಮಗಳುಬಳಕೆದಾರಟಿಪ್ಪಣಿ
ಪ್ರಸಕ್ತ೧೭:೧೩, ೧ ಆಗಸ್ಟ್ ೨೦೨೩೧೭:೧೩, ೧ ಆಗಸ್ಟ್ ೨೦೨೩ ವರೆಗಿನ ಆವೃತ್ತಿಯ ಕಿರುನೋಟ೯೬೦ × ೯೬೦ (೧.೦೭ MB)Jirka DlFile uploaded using svgtranslate tool (https://svgtranslate.toolforge.org/). Added translation for cs.
೦೧:೨೫, ೧೯ ಆಗಸ್ಟ್ ೨೦೨೧೦೧:೨೫, ೧೯ ಆಗಸ್ಟ್ ೨೦೨೧ ವರೆಗಿನ ಆವೃತ್ತಿಯ ಕಿರುನೋಟ೯೬೦ × ೯೬೦ (೧.೦೭ MB)EfbrazilUpdated to AR6
೨೧:೩೦, ೧೩ ಮೇ ೨೦೨೦೨೧:೩೦, ೧೩ ಮೇ ೨೦೨೦ ವರೆಗಿನ ಆವೃತ್ತಿಯ ಕಿರುನೋಟ೯೬೦ × ೯೬೦ (೧.೭೪ MB)NyqDecapitalized common nouns
೨೩:೫೫, ೩೦ ಮಾರ್ಚ್ ೨೦೨೦೨೩:೫೫, ೩೦ ಮಾರ್ಚ್ ೨೦೨೦ ವರೆಗಿನ ಆವೃತ್ತಿಯ ಕಿರುನೋಟ೯೬೦ × ೯೬೦ (೧.೭೪ MB)EfbrazilVery fiddly tweak, changed positioning / size of CO2 subscript
೨೨:೪೭, ೩೦ ಮಾರ್ಚ್ ೨೦೨೦೨೨:೪೭, ೩೦ ಮಾರ್ಚ್ ೨೦೨೦ ವರೆಗಿನ ಆವೃತ್ತಿಯ ಕಿರುನೋಟ೯೬೦ × ೯೬೦ (೧.೭೪ MB)EfbrazilDropping space between RCP and number as per review
೨೩:೩೪, ೯ ಮಾರ್ಚ್ ೨೦೨೦೨೩:೩೪, ೯ ಮಾರ್ಚ್ ೨೦೨೦ ವರೆಗಿನ ಆವೃತ್ತಿಯ ಕಿರುನೋಟ೯೬೦ × ೯೬೦ (೧.೭೪ MB)EfbrazilUploaded own work with UploadWizard

ಈ ಕೆಳಗಿನ ಪುಟವು ಈ ಚಿತ್ರಕ್ಕೆ ಸಂಪರ್ಕ ಹೊಂದಿದೆ:

ಜಾಗತಿಕ ಕಡತ ಉಪಯೋಗ

ಈ ಕಡತವನ್ನು ಕೆಳಗಿನ ಬೇರೆ ವಿಕಿಗಳೂ ಉಪಯೋಗಿಸುತ್ತಿವೆ:

ಮೇಲ್ದರ್ಜೆ ಮಾಹಿತಿ