ಚಿತ್ರ:Kinked demand.svg

Size of this PNG preview of this SVG file: ೫೮೦ × ೪೮೦ ಪಿಕ್ಸೆಲ್ಗಳು. ಇತರ ರೆಸಲ್ಯೂಶನ್ಗಳು: ೨೯೦ × ೨೪೦ ಪಿಕ್ಸೆಲ್ಗಳು | ೯೨೮ × ೭೬೮ ಪಿಕ್ಸೆಲ್ಗಳು | ೧,೨೩೭ × ೧,೦೨೪ ಪಿಕ್ಸೆಲ್ಗಳು | ೨,೪೭೫ × ೨,೦೪೮ ಪಿಕ್ಸೆಲ್ಗಳು.
ಮೂಲ ಕಡತ (SVG ಫೈಲು, ಸುಮಾರಾಗಿ ೫೮೦ × ೪೮೦ ಚಿತ್ರಬಿಂದುಗಳು, ಫೈಲಿನ ಗಾತ್ರ: ೨ KB)
ಈ ಫೈಲು ವಿಕಿಮೀಡಿಯ ಕಾಮನ್ಸ್ನಲ್ಲಿ ಇರುವುದು. ಅಲ್ಲಿನ ವಿವರಣೆ ಪುಟವನ್ನೇ ಕೆಳಗೆ ತೋರಿಸಲಾಗಿದೆ. ಕಾಮನ್ಸ್ ಕೃತಿಸ್ವಾಮ್ಯತೆಯಿಂದ ಮುಕ್ತ ಫೈಲುಗಳ ಒಂದು ಆಗರ. ಅಲ್ಲಿ ನೀವೂ ಸಹಕರಿಸಬಹುದು. |

|
This SVG file contains embedded text that can be translated into your language, using any capable SVG editor, text editor or the SVG Translate tool. For more information see: About translating SVG files. |
| ವಿವರ |
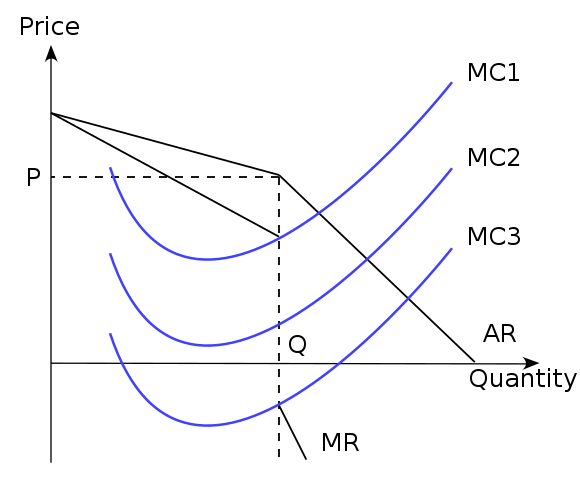
English: A diagram illustrating kinked demand, one formulation for explaining price stability in oligopolies. The demand curve the oligopolist faces is that of two separate curves spliced together, creating a discontinuity in the MR curve. This means that a profit maximising firm will still produce at quantity Q and price P if marginal costs are equal to MC1, MC2 or MC3, thus explaining price stability. (Here, both curves are illustrated as linear, though the concept would work exactly the same if they were not.) |
| ದಿನಾಂಕ | (UTC) |
| ಆಕರ | |
| ಕರ್ತೃ |
|
ಈ ಕಡತ ಕ್ರಿಯೇಟಿವ್ ಕಾಮನ್ಸ್ Attribution
-Share Alike 3.0 Unported ಪರವಾನಗಿ ಹೊಂದಿದೆ.
- ನೀವು ಮುಕ್ತ:
- ಹಂಚಿಕೆಗೆ – ಕೆಲಸವನ್ನು ನಕಲು ಮಾಡಲು, ವಿತರಣೆ ಮತ್ತು ಸಾಗಿಸಲು
- ರೀಮಿಕ್ಸ್ ಮಾಡಲು – ಕೆಲಸವನ್ನು ಬಳಸಿಕೊಳ್ಳಲು
- ಈ ಕೆಳಗಿನ ಷರತ್ತುಗಳಲ್ಲಿ:
- ವೈಶಿಷ್ಟ್ಯ – ನೀವು ಸೂಕ್ತವಾದ ಕ್ರೆಡಿಟ್ ನೀಡಬೇಕು, ಪರವಾನಗಿಗೆ ಲಿಂಕ್ ಅನ್ನು ಒದಗಿಸಬೇಕು ಮತ್ತು ಯಾವುದೇ ಬದಲಾವಣೆಗಳನ್ನು ಮಾಡಿದ್ದರೆ ಸೂಚಿಸಬೇಕು. ನೀವು ಯಾವುದೇ ಸಮಂಜಸವಾದ ರೀತಿಯಲ್ಲಿ ಮಾಡಬಹುದು, ಆದರೆ ಪರವಾನಗಿದಾರರು ನಿಮ್ಮನ್ನು ಅಥವಾ ನಿಮ್ಮ ಯಾವುದೇ ಬಳಕೆಯನ್ನು ಅನುಮೋದಿಸಿದಂತೆ ರೀತಿಯಲ್ಲಿ ಉಪಯೋಗಿಸಬಾರದು.
- ಇರುವುದರಂತೆಯೇ ಹಂಚು – ನೀವು ರೀಮಿಕ್ಸ್ ಮಾಡಿದರೆ, ರೂಪಾಂತರಗೊಳಿಸಿದರೆ ಅಥವಾ ವಸ್ತುವಿನ ಮೇಲೆ ನಿರ್ಮಿಸಿದರೆ, ನಿಮ್ಮ ಕೊಡುಗೆಗಳನ್ನು ನೀವು ಮೂಲದಂತೆ ಅದೇ ಅಥವಾ ಹೊಂದಾಣಿಕೆಯ ಪರವಾನಗಿ ಅಡಿಯಲ್ಲಿ ವಿತರಿಸಬೇಕು.
Original upload log
This image is a derivative work of the following images:
- File:Perfect_competition_in_the_short_run.svg licensed with Cc-by-sa-3.0
- 2010-10-15T16:18:39Z Jarry1250 580x400 (2908 Bytes) == int:filedesc == == int:filedesc == Better economics
- 2010-10-05T20:59:03Z Jarry1250 560x400 (3824 Bytes) == Summary == Economics error fixed.
- 2010-10-05T20:52:52Z Jarry1250 560x400 (3823 Bytes) == Summary == Try to realign again.
- 2010-10-05T20:51:10Z Jarry1250 560x400 (3823 Bytes) == Summary == == Summary == Minor fixes
- 2010-10-05T20:45:52Z Jarry1250 560x400 (3803 Bytes) {{Information |Description={{en|Diagram showing that it is possible that a firm in [[:en:perfect competition|]] makes an [[:en:Economic profit|abnormal profit]], if P > min(ATC). In the [[:en:long run|]], however, only normal
Uploaded with derivativeFX
ಕಡತದ ಇತಿಹಾಸ
ದಿನ/ಕಾಲ ಒತ್ತಿದರೆ ಆ ಸಮಯದಲ್ಲಿ ಈ ಕಡತದ ವಸ್ತುಸ್ಥಿತಿ ತೋರುತ್ತದೆ.
| ದಿನ/ಕಾಲ | ಕಿರುನೋಟ | ಆಯಾಮಗಳು | ಬಳಕೆದಾರ | ಟಿಪ್ಪಣಿ | |
|---|---|---|---|---|---|
| ಪ್ರಸಕ್ತ | ೦೧:೧೦, ೨ ಜನವರಿ ೨೦೧೧ | | ೫೮೦ × ೪೮೦ (೨ KB) | Jarry1250 | {{Translation possible}} {{Information |Description={{en|A diagram illustrating en:kinked demand, one formulation for explaining price stability in oligopolies. The demand curve the oligopolist faces is that of two separate curves |
ಕಡತ ಬಳಕೆ
ಈ ಕೆಳಗಿನ 2 ಪುಟಗಳು ಈ ಚಿತ್ರಕ್ಕೆ ಸಂಪರ್ಕ ಹೊಂದಿವೆ:
ಜಾಗತಿಕ ಕಡತ ಉಪಯೋಗ
ಈ ಕಡತವನ್ನು ಕೆಳಗಿನ ಬೇರೆ ವಿಕಿಗಳೂ ಉಪಯೋಗಿಸುತ್ತಿವೆ:
- en.wikipedia.org ಮೇಲೆ ಬಳಕೆ
- fr.wikipedia.org ಮೇಲೆ ಬಳಕೆ
- hy.wikipedia.org ಮೇಲೆ ಬಳಕೆ
- ru.wikipedia.org ಮೇಲೆ ಬಳಕೆ