ಚಿತ್ರ:2005fuel import.PNG
ಈ ಮುನ್ನೋಟ ಗಾತ್ರ:೮೦೦ × ೩೫೧ ಪಿಕ್ಸೆಲ್ಗಳು. ಇತರ ರೆಸಲ್ಯೂಶನ್ಗಳು: ೩೨೦ × ೧೪೦ ಪಿಕ್ಸೆಲ್ಗಳು | ೬೪೦ × ೨೮೧ ಪಿಕ್ಸೆಲ್ಗಳು | ೧,೪೨೫ × ೬೨೫ ಪಿಕ್ಸೆಲ್ಗಳು.
ಮೂಲ ಕಡತ (೧,೪೨೫ × ೬೨೫ ಚಿತ್ರಬಿಂದು, ಫೈಲಿನ ಗಾತ್ರ: ೬೦ KB, MIME ಪ್ರಕಾರ: image/png)
ಈ ಫೈಲು ವಿಕಿಮೀಡಿಯ ಕಾಮನ್ಸ್ನಲ್ಲಿ ಇರುವುದು. ಅಲ್ಲಿನ ವಿವರಣೆ ಪುಟವನ್ನೇ ಕೆಳಗೆ ತೋರಿಸಲಾಗಿದೆ. ಕಾಮನ್ಸ್ ಕೃತಿಸ್ವಾಮ್ಯತೆಯಿಂದ ಮುಕ್ತ ಫೈಲುಗಳ ಒಂದು ಆಗರ. ಅಲ್ಲಿ ನೀವೂ ಸಹಕರಿಸಬಹುದು. |
ಸಾರಾಂಶ
| ವಿವರ |
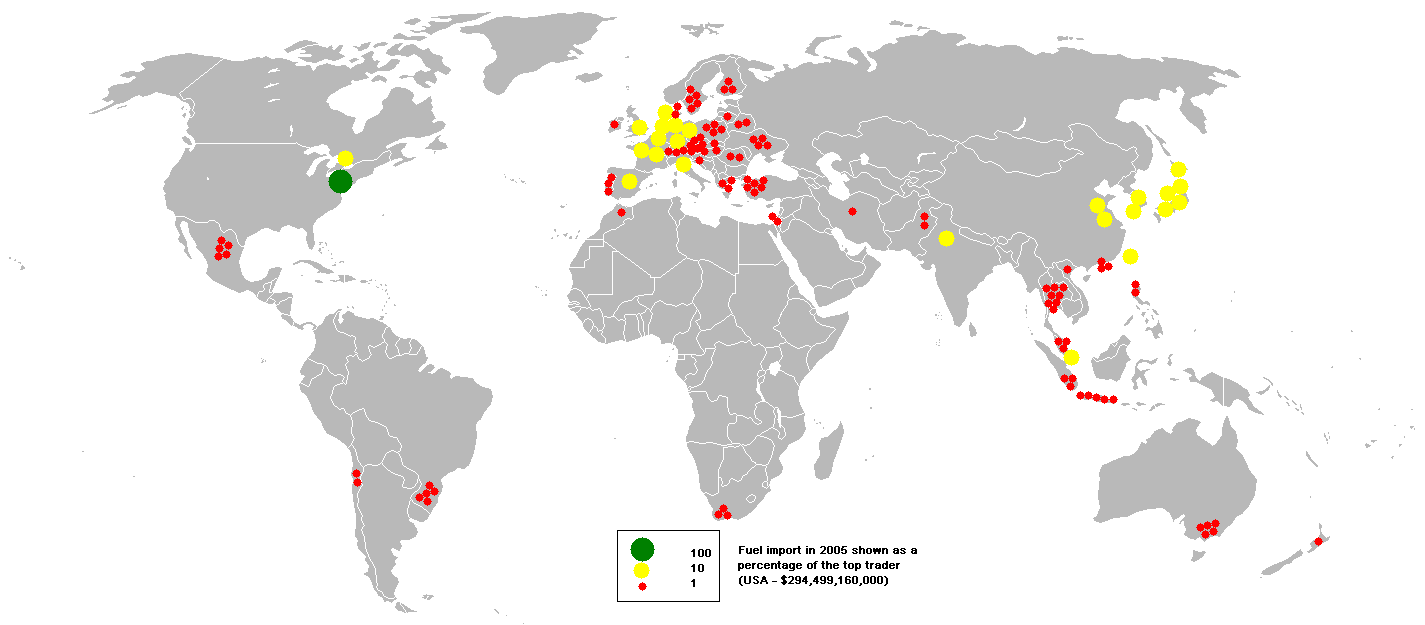
English: This bubble map shows the global distribution of fuel imports in 2005 as a percentage of the top trader (USA - $294,499,160,000).
This map is consistent with incomplete set of data too as long as the top producer is known. It resolves the accessibility issues faced by colour-coded maps that may not be properly rendered in old computer screens. Data was extracted on 20th June 2007 from http://siteresources.worldbank.org/DATASTATISTICS/Resources/table4_5.pdf Based on :Image:BlankMap-World.png |
| ದಿನಾಂಕ | ಜೂನ್ ೨೦, ೨೦೦೭ (original upload date) |
| ಆಕರ | Transferred from en.wikipedia to Commons by Stefan4 using CommonsHelper. |
| ಕರ್ತೃ | Anwar saadat at ಇಂಗ್ಲಿಷ್ ವಿಕಿಪೀಡಿಯ |
ಪರವಾನಗಿ
Anwar saadat at ಇಂಗ್ಲಿಷ್ ವಿಕಿಪೀಡಿಯ, the copyright holder of this work, hereby publishes it under the following license:
ಈ ಕಡತ ಕ್ರಿಯೇಟಿವ್ ಕಾಮನ್ಸ್ Attribution
-Share Alike 3.0 Unported ಪರವಾನಗಿ ಹೊಂದಿದೆ.
ವೈಶಿಷ್ಟ್ಯ: Anwar saadat at ಇಂಗ್ಲಿಷ್ ವಿಕಿಪೀಡಿಯ
- ನೀವು ಮುಕ್ತ:
- ಹಂಚಿಕೆಗೆ – ಕೆಲಸವನ್ನು ನಕಲು ಮಾಡಲು, ವಿತರಣೆ ಮತ್ತು ಸಾಗಿಸಲು
- ರೀಮಿಕ್ಸ್ ಮಾಡಲು – ಕೆಲಸವನ್ನು ಬಳಸಿಕೊಳ್ಳಲು
- ಈ ಕೆಳಗಿನ ಷರತ್ತುಗಳಲ್ಲಿ:
- ವೈಶಿಷ್ಟ್ಯ – ನೀವು ಸೂಕ್ತವಾದ ಕ್ರೆಡಿಟ್ ನೀಡಬೇಕು, ಪರವಾನಗಿಗೆ ಲಿಂಕ್ ಅನ್ನು ಒದಗಿಸಬೇಕು ಮತ್ತು ಯಾವುದೇ ಬದಲಾವಣೆಗಳನ್ನು ಮಾಡಿದ್ದರೆ ಸೂಚಿಸಬೇಕು. ನೀವು ಯಾವುದೇ ಸಮಂಜಸವಾದ ರೀತಿಯಲ್ಲಿ ಮಾಡಬಹುದು, ಆದರೆ ಪರವಾನಗಿದಾರರು ನಿಮ್ಮನ್ನು ಅಥವಾ ನಿಮ್ಮ ಯಾವುದೇ ಬಳಕೆಯನ್ನು ಅನುಮೋದಿಸಿದಂತೆ ರೀತಿಯಲ್ಲಿ ಉಪಯೋಗಿಸಬಾರದು.
- ಇರುವುದರಂತೆಯೇ ಹಂಚು – ನೀವು ರೀಮಿಕ್ಸ್ ಮಾಡಿದರೆ, ರೂಪಾಂತರಗೊಳಿಸಿದರೆ ಅಥವಾ ವಸ್ತುವಿನ ಮೇಲೆ ನಿರ್ಮಿಸಿದರೆ, ನಿಮ್ಮ ಕೊಡುಗೆಗಳನ್ನು ನೀವು ಮೂಲದಂತೆ ಅದೇ ಅಥವಾ ಹೊಂದಾಣಿಕೆಯ ಪರವಾನಗಿ ಅಡಿಯಲ್ಲಿ ವಿತರಿಸಬೇಕು.
Original upload log
The original description page was here. All following user names refer to en.wikipedia.
- 2007-06-20 16:00 Anwar saadat 1425×625× (61453 bytes)
ಕಡತದ ಇತಿಹಾಸ
ದಿನ/ಕಾಲ ಒತ್ತಿದರೆ ಆ ಸಮಯದಲ್ಲಿ ಈ ಕಡತದ ವಸ್ತುಸ್ಥಿತಿ ತೋರುತ್ತದೆ.
| ದಿನ/ಕಾಲ | ಕಿರುನೋಟ | ಆಯಾಮಗಳು | ಬಳಕೆದಾರ | ಟಿಪ್ಪಣಿ | |
|---|---|---|---|---|---|
| ಪ್ರಸಕ್ತ | ೦೧:೪೮, ೧೧ ನವೆಂಬರ್ ೨೦೧೧ | | ೧,೪೨೫ × ೬೨೫ (೬೦ KB) | File Upload Bot (Magnus Manske) | {{BotMoveToCommons|en.wikipedia|year={{subst:CURRENTYEAR}}|month={{subst:CURRENTMONTHNAME}}|day={{subst:CURRENTDAY}}}} {{Information |Description={{en|This bubble map shows the global distribution of fuel impor |
ಕಡತ ಬಳಕೆ
ಈ ಕೆಳಗಿನ ಪುಟವು ಈ ಚಿತ್ರಕ್ಕೆ ಸಂಪರ್ಕ ಹೊಂದಿದೆ:
ಜಾಗತಿಕ ಕಡತ ಉಪಯೋಗ
ಈ ಕಡತವನ್ನು ಕೆಳಗಿನ ಬೇರೆ ವಿಕಿಗಳೂ ಉಪಯೋಗಿಸುತ್ತಿವೆ: